Measuring progress towards the SDGs
Measuring progress towards the SDGs
In 2015, leaders from every country in the world agreed to 17 goals to create a better future for all people, everywhere, by 2030. The Sustainable Development Goals promised that no one will be left behind by progress, and that people who are furthest behind are reached first.
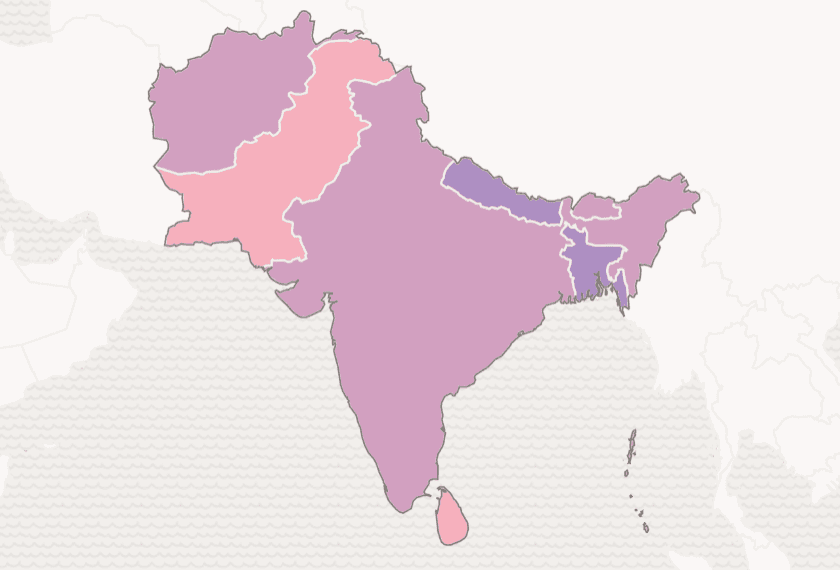
New visualisations across the Child Atlas help us to monitor our progress towards these essential goals for children. Here we explain how we determine countries’ progress across different measures.
Past progress to the SDGs
In 2023, UNICEF has conducted an extensive analysis to measure and benchmark progress on 48 child-relevant SDG indicators. As part of this analysis, they have estimated how strong national-level progress has been towards the SDGs so far for each indicator. Comparing different performances across countries and time, recent progress has been categorised into 5 categories (very weak/weak/average/strong/very strong).
You can find information on past progress for any SDG indicator on the Atlas page or within country profiles.
Inclusive progress
Focusing on changes in the national average hide significant and consistent inequalities, as children are regularly denied their rights because of where they grow up, their sex or ethnicity, whether they have a disability, or the economic backgrounds of their parents. The SDGs provided a compelling approach to combating what are manifestly unfair inequalities, pledging that “no one will be left behind […] and we will endeavour to reach the furthest behind first”. Ensuring that ‘all segments of society’ achieve the 2030 goals requires that those most distant from the target move faster than groups already closer to the targets.
We analyse this process of convergence to understand if gaps are narrowed between those most impacted by inequality and discrimination, and their more advantaged peers. Using publicly available disaggregated data on selected indicators (all of which can be found directly in the Child Atlas), we calculate the annual rate of reduction since 2000 for each group on which we have comparable data. This includes currently gender, residence and wealth. We then classify a country as experiencing inclusive progressive, if over the last two decades they 1) progressed towards the targets set out in the 2030 agenda, and 2) in that process closed gaps between boys and girls, rural and urban areas, and richer and poorer families.
You can find information on inclusive progress for selected SDG indicators on the Atlas page or within country profiles.
Country on track to reach the SDGs
While the previous measures focus on past progress towards the SDGs, this particular one looks ahead, estimating if the country as a whole is likely to reach the goals by 2030. For this particular measure, we again rely on UNICEF’s assessment for each of the 48 child-relevant SDG indicators. We then reclassify their findings into an easily understandable traffic light system: green indicating that a country has either already met a target or needs only very low effort to get there. Yellow shows countries that require low or average levels of effort to reach the target. Red indicates countries which need high or very high levels of effort.
You can find this measure on the Atlas page or within country profiles. We also provide an easy heatmap for ‘countries on track’ for selected SDG indicators on our SDG overview page. The heatmap initially shows an overall rating for SDGs 1-6 and 16. This traffic-light-rating depends on the average progress for individual SDGs (as long as data is available for at least half of the indicators). You can explore the individual indicators by expanding each of the goals.
Groups on track to reach the SDGs
Mirroring the analysis of inclusive progress, our last measure focuses on group-specific progress towards the SDGs. This allows us to estimate if countries are on track to deliver on the pledge to deliver the goals by 2030 for ‘all segments of society’.
Using disaggregated data for selected SDG indicators, we estimate if all groups are on track to reach the SDGs, comparing their individual rate of change in the past with the change required to reach the SDG targets. For each indicator, we can classify countries into one of the three categories: 1) all groups reach target, 2) the national average and some groups reach target, 3) the national average and most groups are off target.
You can find information on this measure for selected SDG indicators on the Atlas page or within country profiles.
Data availability
The lack of comparable and high-quality data even halfway through the SDGs means we can only paint an incomplete picture of where the world is delivering on their promises for children. Despite impressive progress in many statistical organisations to develop methodologies and collect data for around 230 indicators across the 17 goals, the remaining lack of data – shown through the grey areas across our visualisations – means governments and international organisations still flying blind when making decisions affecting children’s rights.
This is particularly true for disaggregated information on individual groups, making it particularly difficult to track the pledge to Leave No One Behind. Furthermore, data is consistently missing for many other communities impacted by discrimination and facing deprivations, which means our analyses of inclusive progress and ‘groups on track to reach the SDGs’ is focused only on a small subset of inequalities (residence, sex and wealth).
Related stories:
Related stories

How a Soap Opera Helped to Reduce Child Marriage
Child protection (CP)
Child protection (CP)
2025-12-09

Does Insurance Benefit Child Health? Lessons from 38 Countries
Health (HL)
2025-11-19