Highlighted Stories
Nightlights and shocks: Understanding disaster recovery pathways using night light data
In a warming world of increasing frequency and severity of natural disasters, it is essential to find approaches and methods that track disaster’s impacts and recovery efforts. Remote sensing data and satellite imagery are powerful tools to provide almost real-time data and is increasingly used to support disaster recovery. However, could these approaches also be used in the long-term to chart the economic recovery after the disaster over time and space? Last year, a research project at Save the Children UK explored the potential use of night-time light (NTL) imagery to understand such long-term impacts.
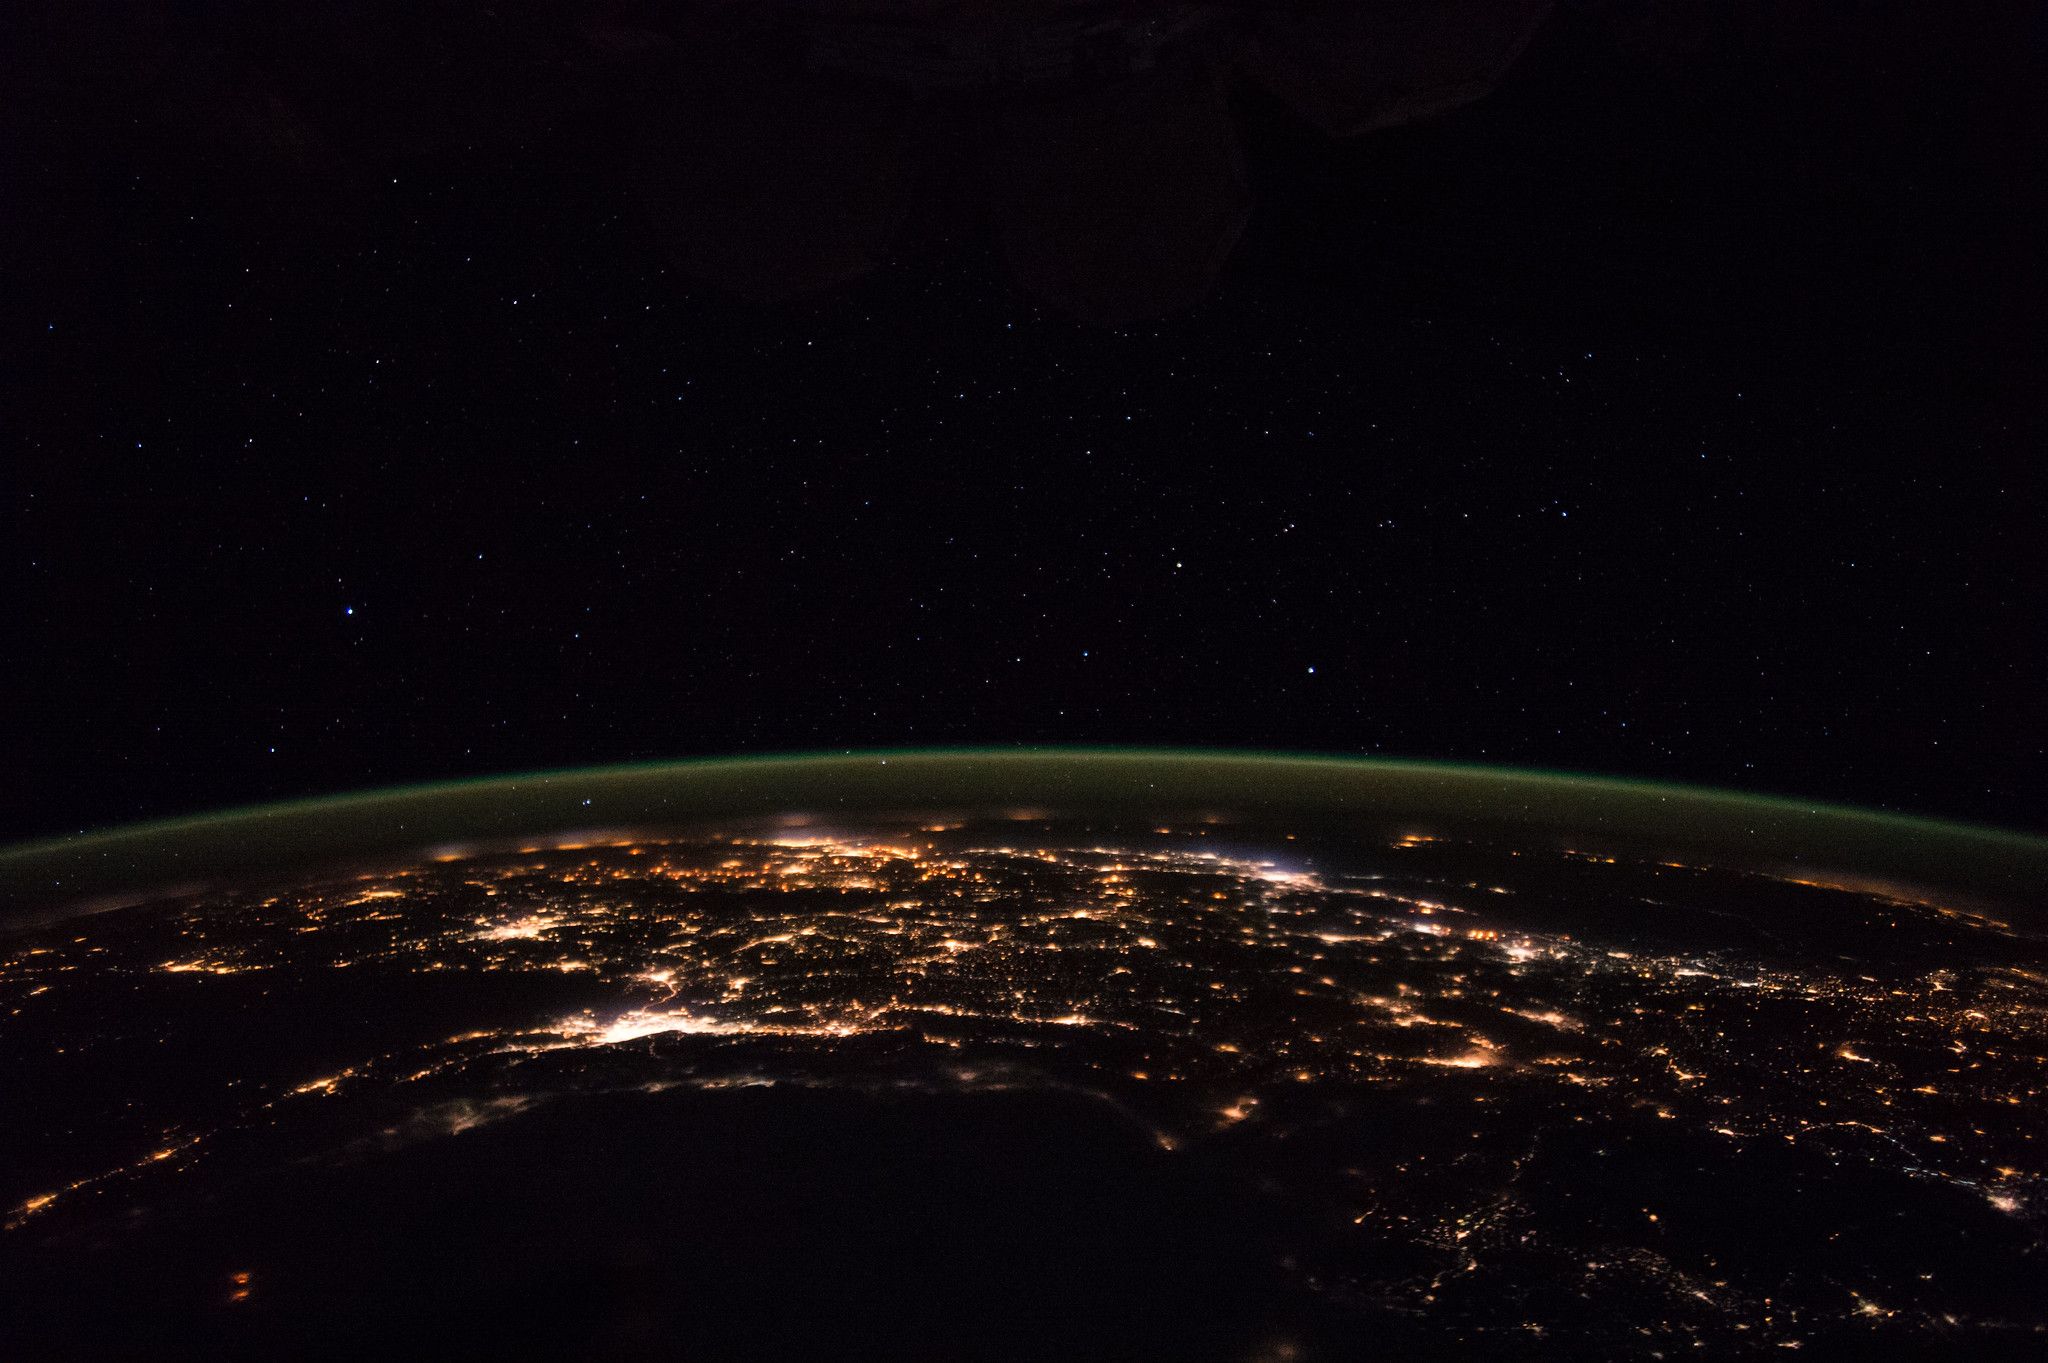
NTL is a form of satellite imagery of the world at night (seen in Figure 1) which shows artificial light sources such as buildings, streetlamps and infrastructure. This data is increasingly easy to access, for example, the World Bank has created a tool which allows free access to NASA’s black marble project to use directly in statistical and data science tools.
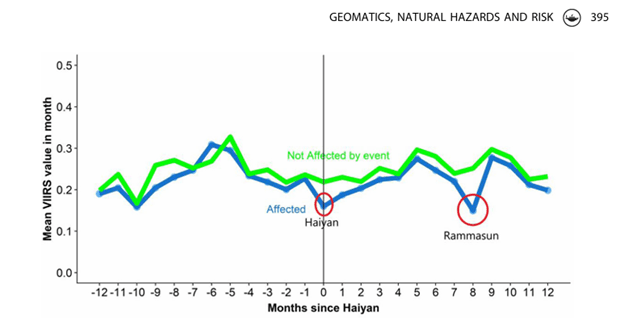
These images have been commonly used as a proxy for economic activities and development as the lights show where large urban centres are located and how they have expanded. In some studies, researchers have started connecting NTL with disasters and recovery efforts. In some studies, researchers have started connecting NTL with disaster and recovery efforts, as seen in Figure 1 below, where Skoufias et. al. (2021) has plotted NTL changes before and after typhoons in the Phillipines. Others such as Zhang et. al. (2023) has compared regional NTL trends during disasters to disaster resilience curves.
Figure 1: Light intensity before, during and after typhoons Haiyan and Rammasun in the Phillipines (source: Skoufias et. al. 2021).
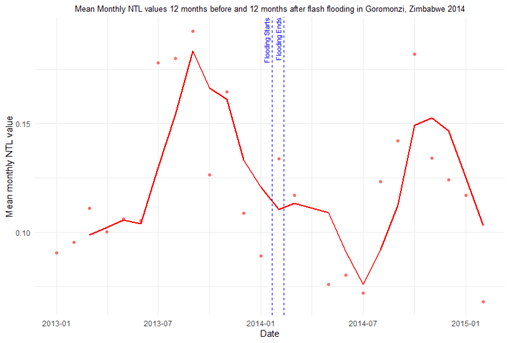
For my UCL Social Data Institute internship with Save the Children UK, I conducted a research project to explore the use of NTL to better understand the socio-economic impacts of disasters. Specifically, I looked at trends before and after disasters in a few selected case studies in Madagascar and Zimbabwe. To do this, I combined NASA’s black marble NTL data with the Geo-coded Disaster Dataset (GDIS) which provided the locations of disasters. Then, I ran a few preliminary plots of the NTL before and after each disaster and some statistical tests. One plot can be seen in Figure 2, which shows the average monthly NTL a year before and a year after a flash flooding event in Goromonzi, Zimbabwe (2014). The graph shows that NTL brightness was reduced in the 6 months after the flooding event, before increasing again. I created a dataset with similar information for flood, storm and drought events in Zimbabwe and Madagascar from 2012 to 2018 (latest GDIS update).
Figure 2: Average NTL values before, during and after flash flooding in Goromonzi, Zimbabwe in 2014
Our project was limited by the short time frame available, the slow processing of nightlight data and the lack of detailed disaster locations; the database mentioned above is not very granular. More work is needed in finding statistical relationships between disasters and NTL changes and thus economic impacts. Furthermore, the type and severity of disasters likely play an important role and it may be helpful to triangulate NTL imagery with other data sources such as the census and locally collected data.
However, we know from other studies that nightlights can play an important role in identifying long-term and significantly economic effects of disasters, as just recently shown for floods in Bangladesh (Patel 2024). My project has shown how NGOs, researchers, governments and other stakeholders can work with NTL data in the future – even when using quite basic statistical software and methods – and highlight the role that these innovative methods can play to track economic changes after disasters.
Related stories:
Related stories
Who benefits from public spending? New evidence on pro-poor investments
Financing & Accountability (FA)
2025-04-07

Children's progress on the SDGs: Racing against time
Indicators by SDGs (SD)
2024-09-26